Sankey diagram
The Sankey diagram visually represents the impacts of processes within the product system on specific flows/impact categories. The diagram shows both the direct contribution and the upstream total contribution of the process. To open a process in a new editor tab, simply double-click on it.
Right-click anywhere in the Sankey diagram editor and select:
-
"Focus" to focus on the process the calculation is based
-
"Minimap" to displays/hides the minimap
-
"Layout as tree" to update the order of the processes
-
"Settings of the Sankey diagram" to select the flow or impact and cut-off level to be displayed.
-
"Save as Image" to save the Sankey diagram as png file.
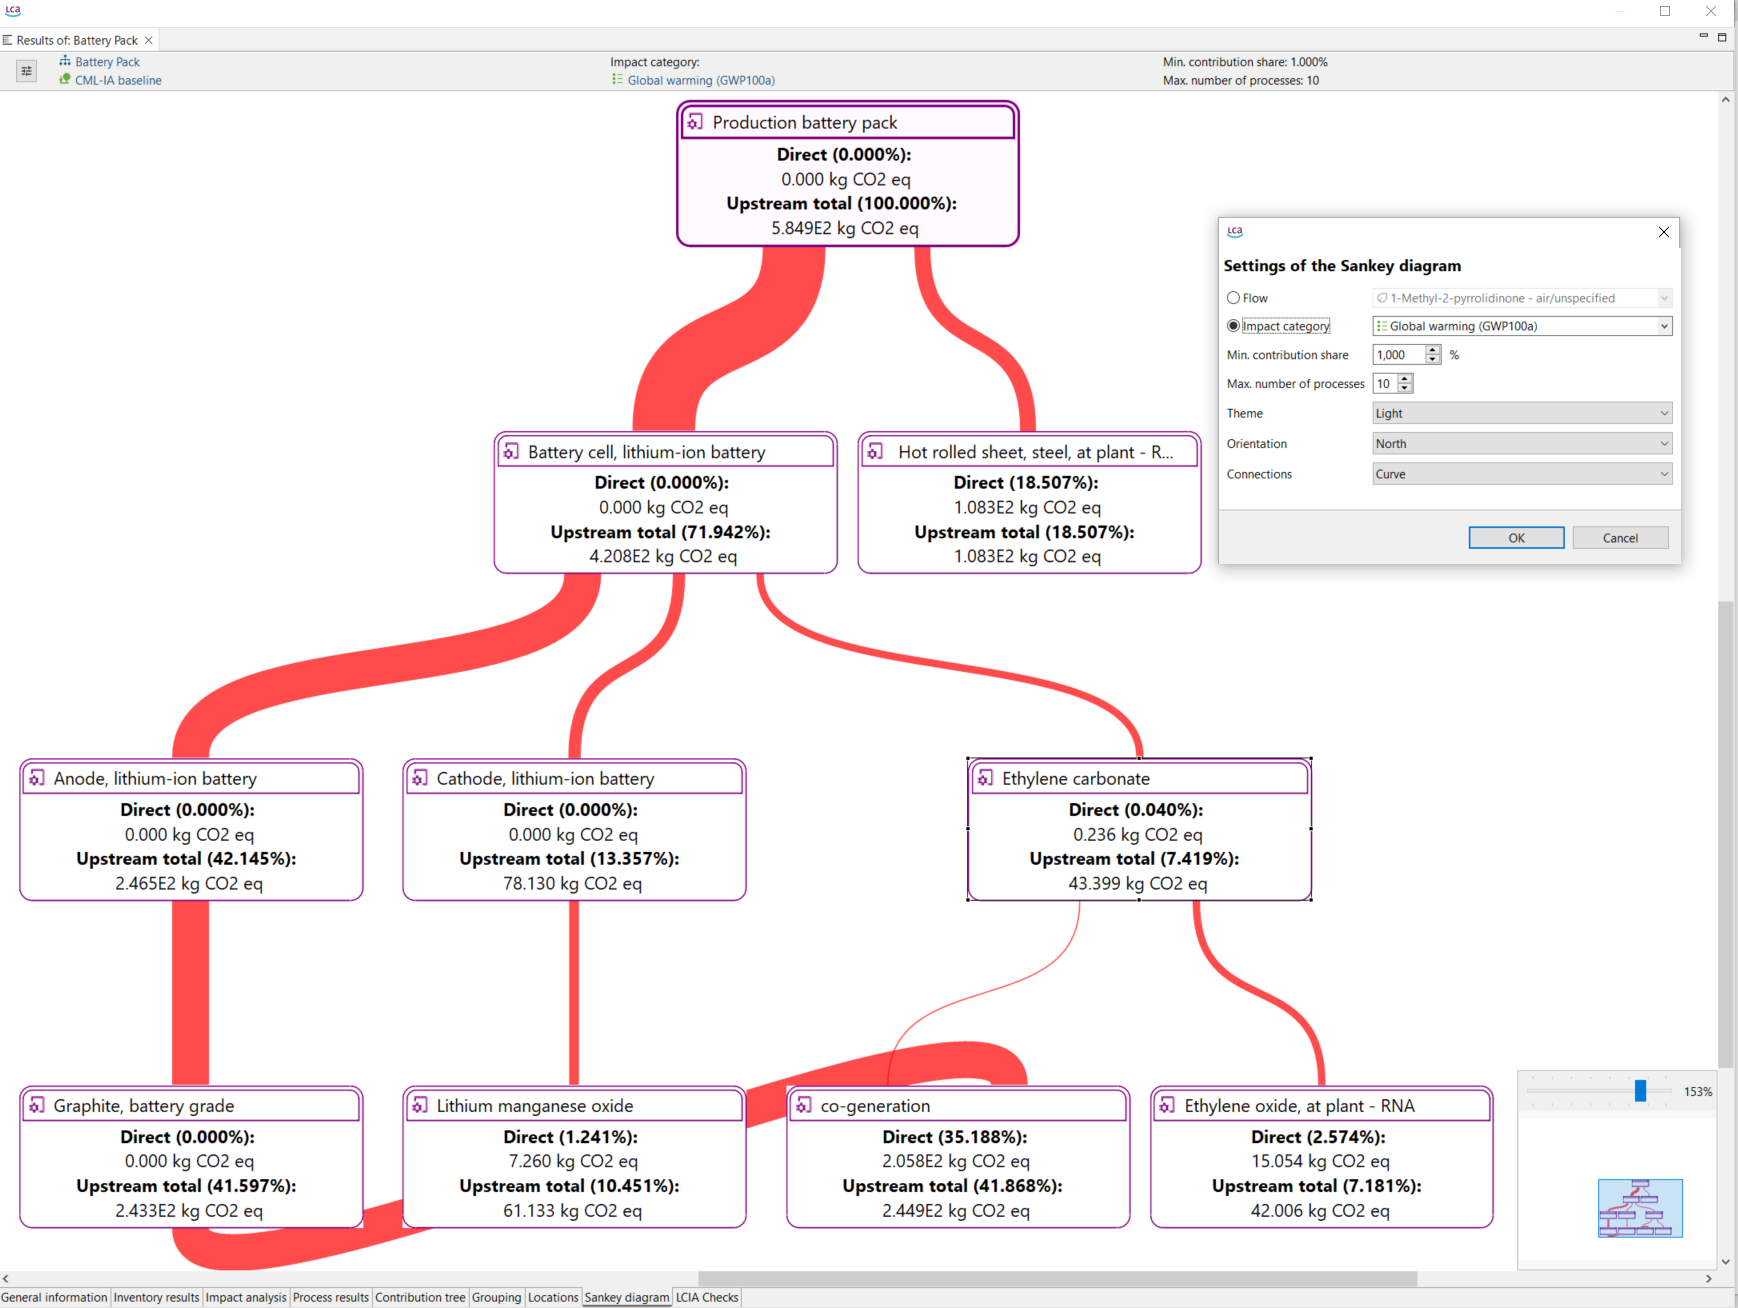
Sankey diagram
You can access the "Setting of the Sankey diagram" wizard by clicking on the "Filter" icon located in the top left corner. Here you can specify:
-
If you want to display a flow or an impact category
-
Cost category (only accessible if you included cost calculations in calculation setup)
-
Min. contribution share (inferior contribution limit for a process to be shown in the diagram)
-
Max. number of processes that can be shown in the diagram
-
Design settings: theme, orientation, shape of the connections
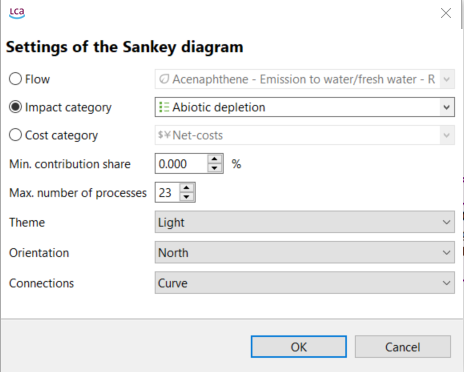
Sankey Setting wizard
Next to the "Filter" icon you can open the product system and the impact assessment method. See the current set "Min. contribution share" and "Max. number of processes".

Sankey diagram options