Contribution tree
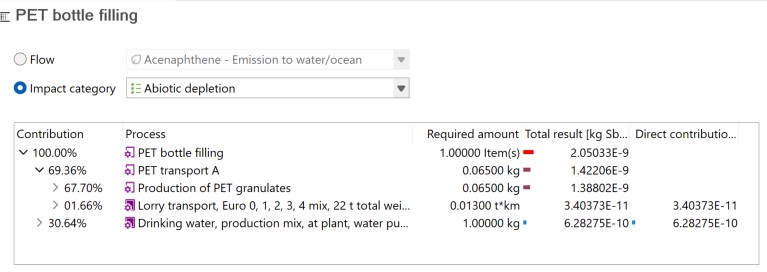
The contribution tree breaks down process contributions to flows and impact categories, displaying upstream totals. This feature allows you to check for every flow in which process is involved, and similarly, for every impact category which are the processes responsible of the impact, and in what percentage. You can access further details expanding the processes by clicking on the little arrow before the percentage. This way, you can see which processes are the largest contributors to a given impact category and which processes are the largest contributors to a given flow emission. Meaning that the contribution tree can be used to easily look for impact hot-spots within the life cycle (processes with the highest contribution).
Note that it can be possible that the percentage of the single processes do not add up to 100%, because the contribution in percentages always display the contribution of the total upstream (supply chain) without the direct contribution of the corresponding process. But you can easily check the absolute amounts of direct contributions inside a process with the last column "Direction contribution" in the contribution tree.
Analysis - Contribution tree tab
If you check the box "Include Cost Calculation" when setting the calculation properties, the contribution tree breaks down process contributions to cost categories (added value or net cost), displaying upstream totals. The economic perspective can be changed by selecting added value or net cost.
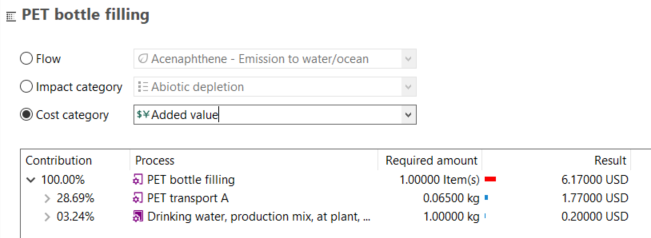
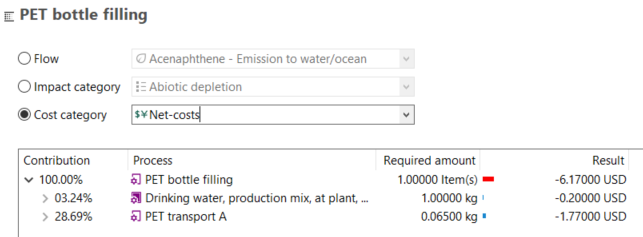
Analysis - Contribution tree tab, cost category